
active participation in elections
Portland voters are among the most active in the U.S. But access to the ballot and engagement is not equal for all. Over the last couple of decades, we see consistent differences in voter participation for young voters and voters who live in more racially diverse and low income neighborhoods. Additionally, we see far lower participation across all demographics and neighborhoods in May primary elections.
Portland’s 2021-22 Charter Commission hoped that changes to the local government system starting this November would lead to a “participatory and growing democracy” with “more voices being heard in elections.”
tracking this goal:
Increased voter participation in future elections could reflect progress toward this goal.
One year of new data won’t be enough to establish trends or identify the root causes. Several years of data will be needed to accurately assess the impact of the new system of elections on voter participation. Learn more about the types of data we’re using, and how to include it in responsible analysis.

About these dashboards: Explore this rich data set by adjusting filters, hovering over graphs and charts to see more data details, and clicking to isolate specific data criteria.
Learn more: Scroll to the bottom of this page to dive deeper into the stories the data tells.
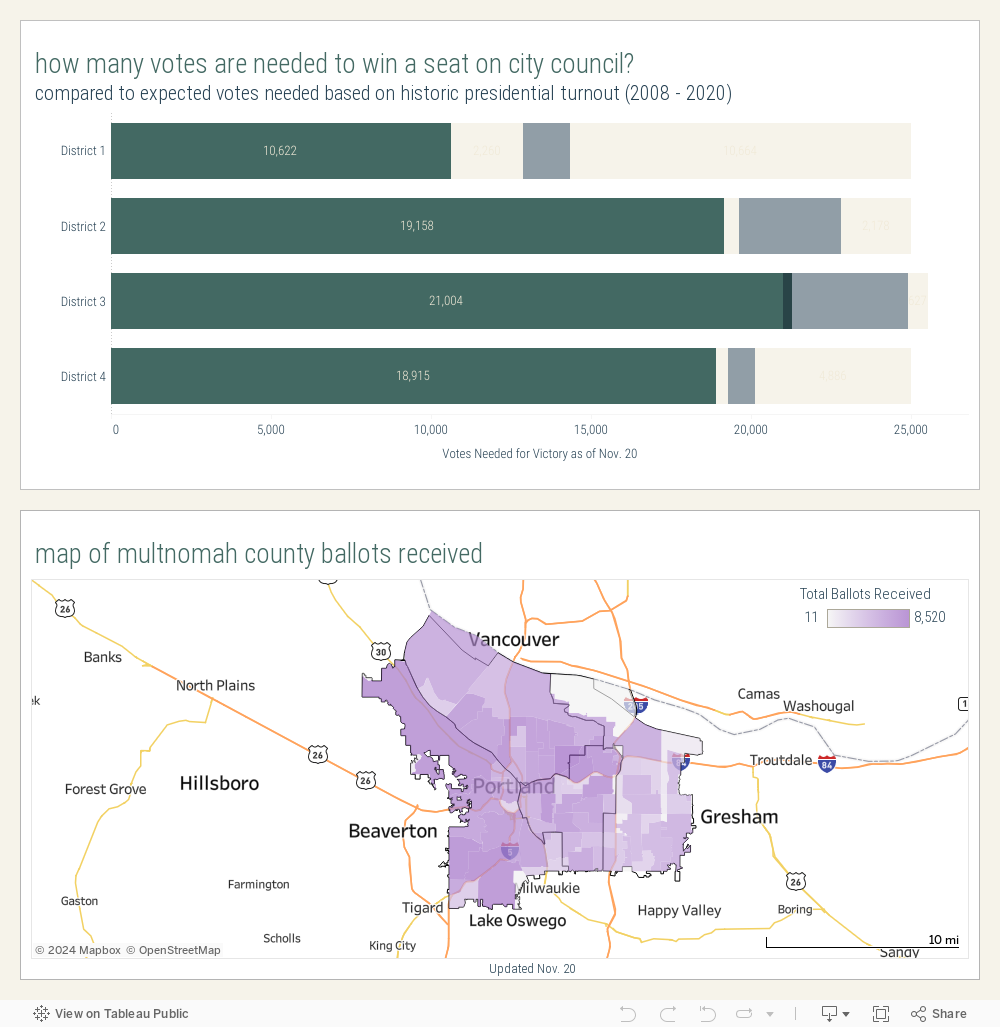
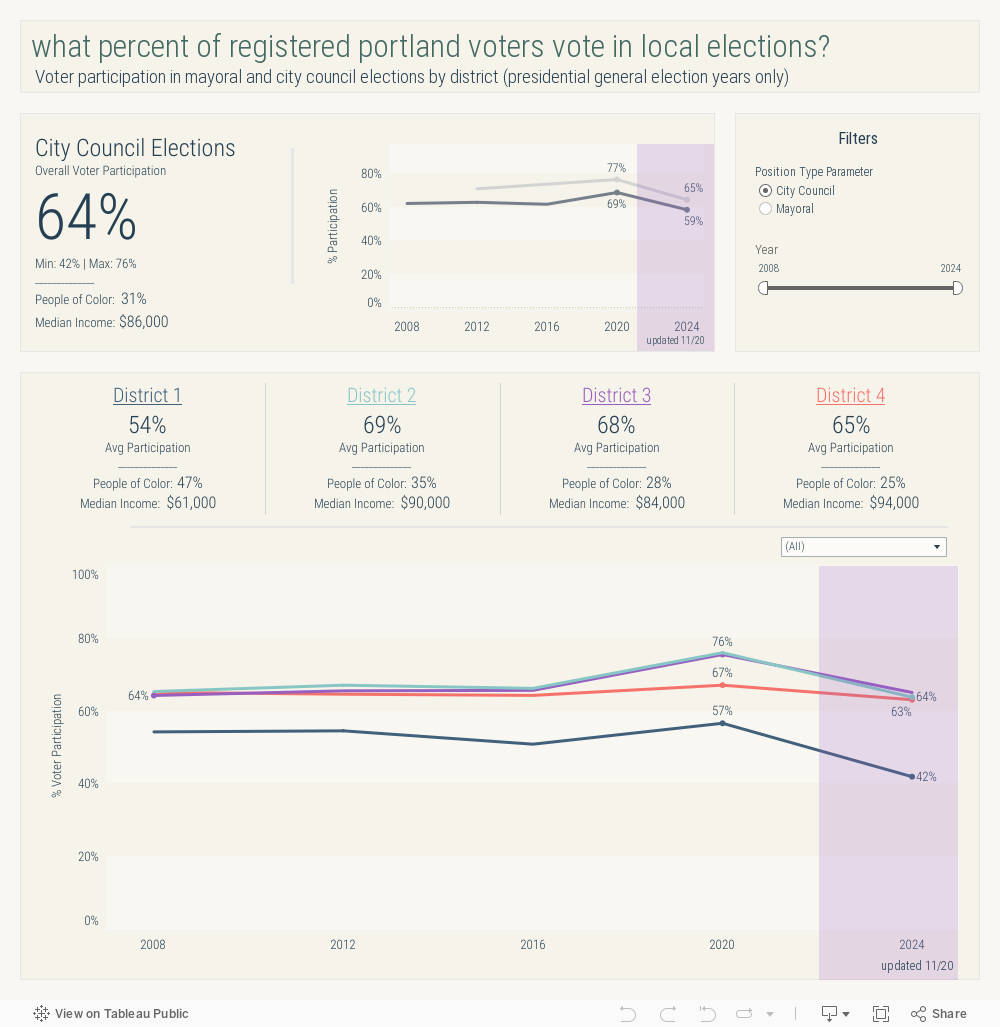
About this data: Although the City of Portland did not have districts before the 2024 election cycle, we think it is valuable to see historic voting trends in the geographic areas that are now districts. These data show voter participation specifically in City-level elections for City Commissioners or Mayor. Currently, we only show data for presidential year general elections between 2008 and 2020. We are working to add data from additional election years, as well as primary election data.
Undervote
Undervote (also known as down-ballot dropoff) over time.
| Position | 2008 | 2012 | 2016 | 2020 | 2024 | |
|---|---|---|---|---|---|---|
| Citywide | Mayor | n/a | 12.5% | n/a | 5.9% | 11.2% |
| Council | 27.6% | 22.4% | 22.2% | 12.6% | 19.5% | District 1 | Mayor | n/a | 13.6% | n/a | 8.8% | 19.6% |
| Council | 31.5% | 24.9% | 24.9 | 19.0% | 29.6% | |
| District 2 | Mayor | n/a | 11.5% | n/a | 4.9% | 8.2% |
| Council | 25.2% | 20.5% | 20.1% | 10.3% | 14.7% | District 3 | Mayor | n/a | 12.1% | n/a | 5.4% | 10.3% |
| Council | 29.6% | 22.1% | 21.0% | 11.1%% | 17.8% | District 4 | Mayor | n/a | 13.3% | n/a | 5.6% | 9.6% |
| Council | 27.9% | 22.8% | 23.9% | 12.6% | 19.2% |
About this data: These data are for Portland precincts in Multnomah County only. While the vast majority of Portland’s voting precincts are in Multnomah County, Portland also has a few precincts in Clackamas County and Washington County. We’re working on adding data for Portland precincts in Clakckamas and Washington County and should have that ready this year.
getting into the data and trends
background
The 2021-22 Portland Charter Commission’s first desired outcome is a “participatory and growing democracy” with “more voices being heard in elections.”
The Commission envisioned a future in which “more Portlanders vote and the electorate is more reflective of our entire community.”
what are indicators of success?
Voter participation in local elections: We measure the percent of all registered Portland voters who vote in mayoral and city council contests. This metric offers insight into how many Portlanders participate in selecting local leaders.
Overall voter turnout: Voter turnout is a measure of the percent of registered voters who vote for any candidate or issue on the ballot–from federal contests, like the President, to state and local ballot measures.
Higher overall turnout and increased voter participation in local elections would indicate progress toward the goals established by the Charter Commission.
Based on recent voter history, we’re specifically looking for increased voter participation in a few areas:
Young voters, who historically vote at a lower rate.
District 1 (East of SE 82nd Ave), where voters have historically voted at a lower rate.
More racially diverse precincts, where voters have historically voted at a lower rate.
about the data
Units of Measure: (1) Voter participation in local election (2) Overall voter turnout
Period of Time: 2008 - 2022
Definitions:
(1) Voter participation in a local contest is the total number of votes cast for a specific office, divided by the number of registered voters city-wide.
(2) Voter turnout is the total number of ballots cast for any contest, divided by the number of registered voters city-wide. Voter turnout is the principal measure of voter engagement.
Sources: (1) Multnomah County Elections, (2) Clackamas County Elections, (3) Washington County Elections
Types of Data: Elections data
Geography: City of Portland, OR
good to know
As of 2024, Portland offices no longer have primary election contests.
While the City of Portland will begin using ranked choice voting in 2024 for local elections, Multnomah County will not use ranked choice voting for county elections until 2026.
race, income, and voter participation
When a person registers to vote, they provide certain information that can be directly connected to them when they cast a ballot — their address, age, and political party (if any). It is relatively simple to analyze voter participation trends connected to the age and political party of voters, and where they live. We can say with certainty “Velma Voter is 23 years old, lives in the Cully neighborhood, and voted in 2022.”
Analyzing voter participation trends connected to other characteristics is more challenging. Race, income, education, or homeownership status are not data collected on the voter registration form. So, analyzing voting trends related to these demographics requires gathering and analyzing data at the community level rather than the individual level.
We cannot say “Velma Voter is a lower income white homeowner.” Instead, we can say, “Velma Voter lives in the Cully neighborhood, which is a lower income and more racially diverse neighborhood in Portland. Overall voter turnout in that precinct is lower than in neighboring precincts.”
By the same token, we can say “Voter participation in lower income and more racially diverse neighborhoods is lower.” But we have to be careful about claiming “BIPOC voters are less likely to vote,” because we do not have data that link voting behavior and race at the individual level.
There are several ways researchers can strengthen observations about the relationship between demographic data like race or income with voter participation data. We’re working on some of this analysis, and should have it available in the coming months.
other resources
Portland Elections created a map that overlays census tract demographic data with precinct-level data on voter turnout.
what the data shows
-
There has been a persistent gap in voter participation between District 1 and Portland's other districts. Between 2008 - 2020, Portlanders in District 1 participated in local elections at a rate of about 10 to 20 percentage points less than Portlanders in other districts. As a result, voters in outer East Portland have not held as much influence over mayoral and city council elections as voters from other parts of the city.
-
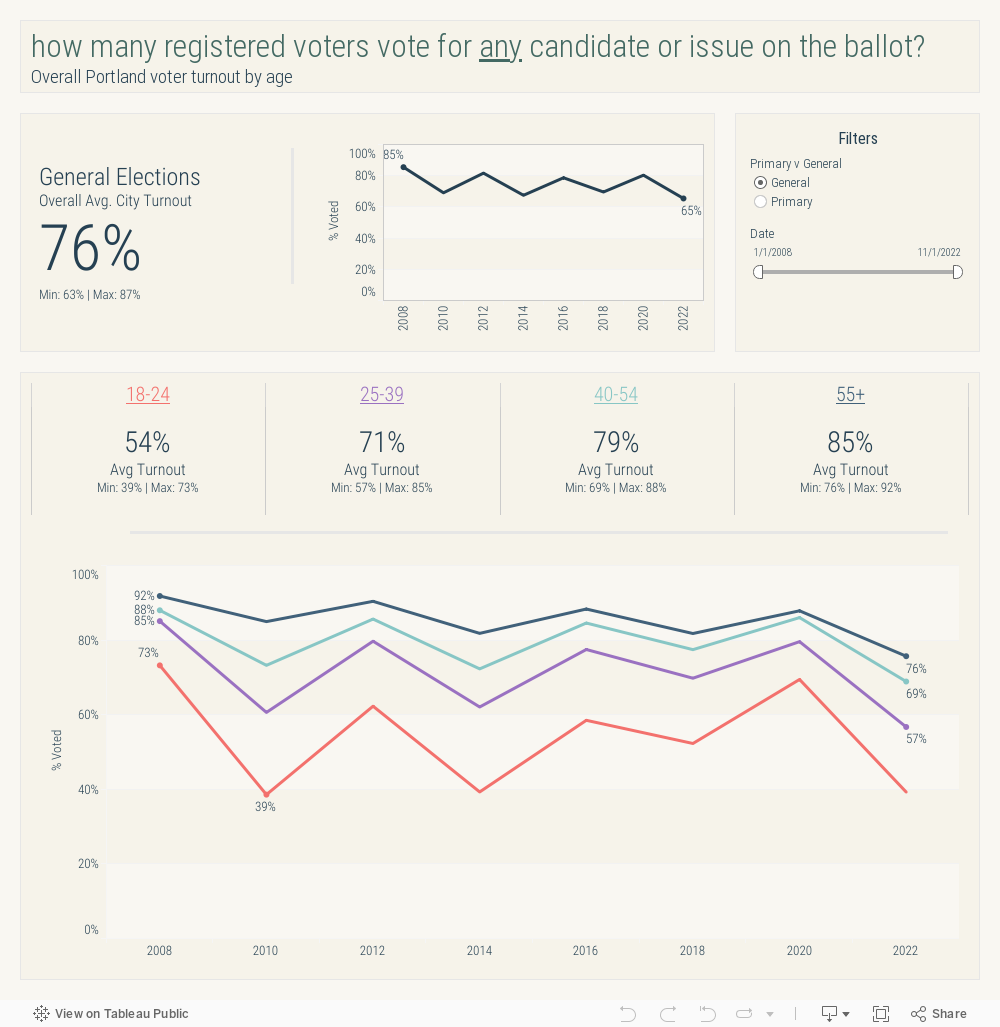
Between 2008 and 2022, older voters participated at a higher rate than younger voters in every election. People ages 55+ voted at rates as much as 40 percentage points higher than people between the ages of 18 – 24. The largest difference in turnout rates between age groups is in non-presidential year primaries, which are also the elections with the lowest overall voter turnout.
-
Older adults vote at higher rates than younger people across the U.S. There are many reasons for this discrepancy: As people get older, they may tend to settle in one place and move less frequently, leading to fewer interruptions in their voter registration. Over time, voting can also become more of a habit and more of a social expectation. As people reach retirement age, they often have more time to devote to keeping up on local news and issues. Portland’s Charter Commission hoped that the changes to Portland’s governing and elections would help to empower and engage all voters, particularly those who have historically voted at lower rates.
Oregon has been a national leader in promoting policy changes that increase access to the ballot, such as vote by mail, automatic voter registration, and counting ballots that are post-marked on Election Day.
-
Voter participation in local elections and overall voter turnout trends follow a consistent timing pattern across election cycles: voter participation peaks during November general elections in presidential election years, and dips to its lowest points during May primary elections in midterm years. In other words, more voters cast ballots for general elections in November than for primary elections in May, and more voters vote during presidential election years than during midterm election years.
-
In Portland and across the country, voters of all ages participate in elections at lower rates during midterm years than during presidential election years. Likewise, fewer voters participate in primary elections than in general elections.
Several factors contribute to lower turnout in primary elections:
In Oregon, closed partisan primaries exclude more than half of all voters under the age of 40, and more than half of Latin@ voters, because both of these groups are less likely to affiliate with a political party. As a result, young and Latin@ voters will not be contacted by campaigns during primaries.
In general, political campaigns spend less money on voter outreach during primary or special elections than during the general election in November. This means that most voters get fewer "touches" reminding them to vote or engaging them in the electoral process.
Although local government elections are typically non-partisan races, fewer voters understand how local governments work or what local officials do. As a result, they are less likely to participate in local elections during the May primary.
Starting in 2024, Portland will no longer hold primary elections for local contests such as City Council and Mayor. Portland voters will only vote for these positions during November general elections. The Portland Charter Commission hoped that by eliminating primary elections, more voters would weigh-in on election outcomes.
community connections
Community groups can help to increase voter turnout.
NextUp, for example, is a local organization that helps more young people get engaged in civic life with voter registration and voter education programs, and could help to bridge the age gap in turnout. Organizations that serve culturally specific communities, like the Asian Pacific American Network of Oregon (APANO) and Native American Youth and Family Center (NAYA) help to bridge the gap in voter participation in communities of color.
Organizations like AARP and the League of Women Voters also help keep older adults engaged in civic life.